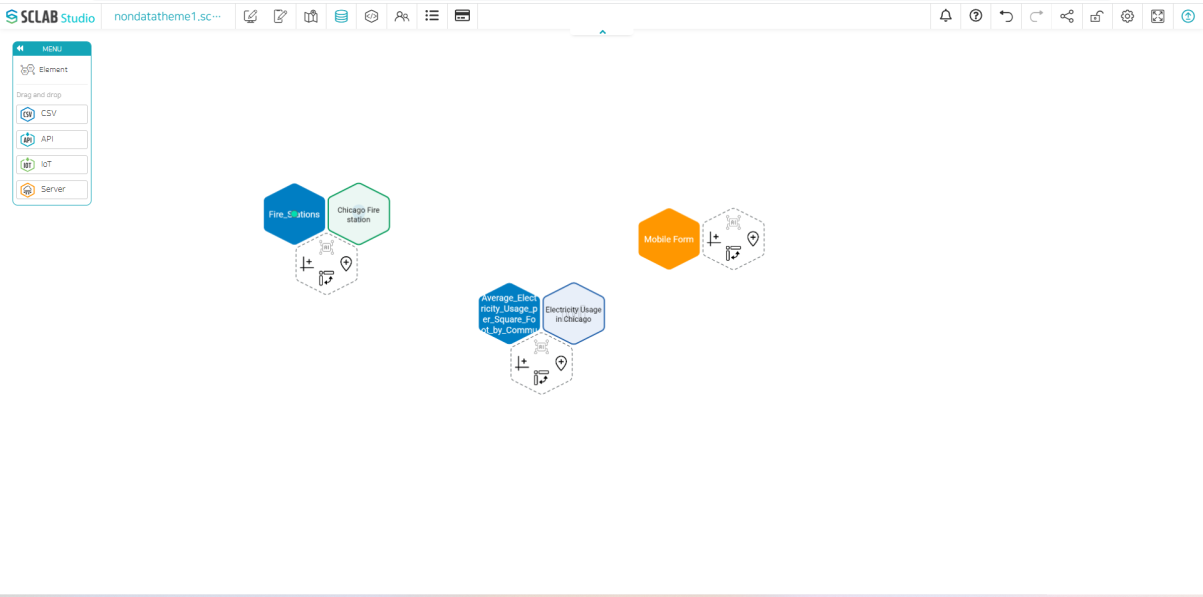
Click the left icon that looks like a graph from the right hexagon of the blue hexagon icon of the CSV data you created.
Select the chart type you want to create and click Next Step. Here, we select Bar Chart (White version).
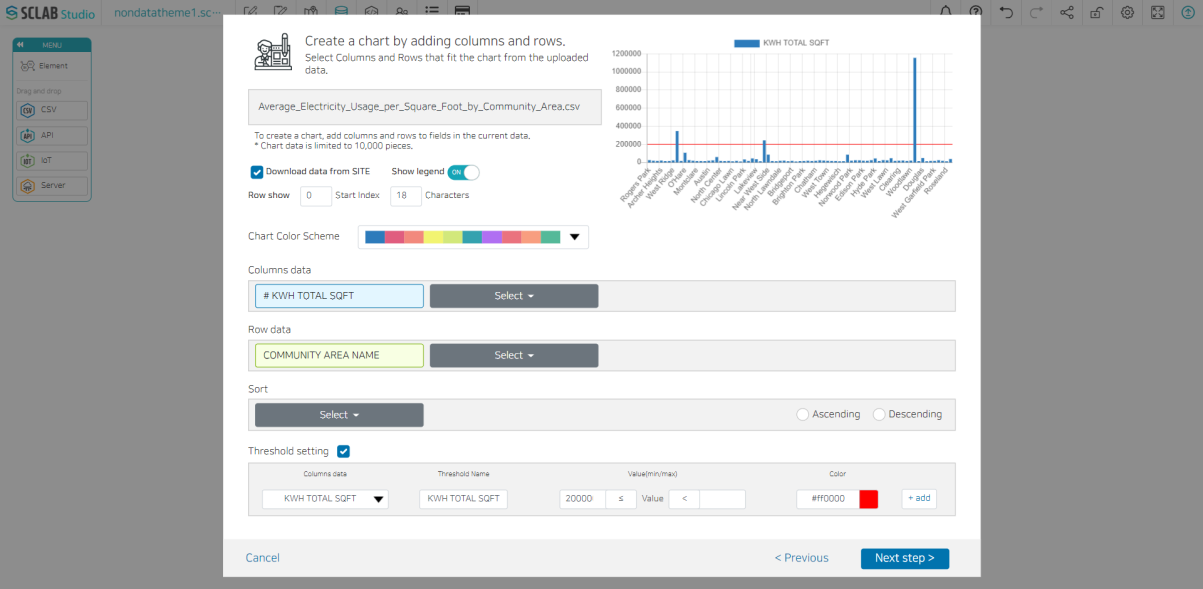
If you check 'Download data from SITE', people can download the data later.
Select whether to expose the legend of the chart.
You can adjust the starting point and the total number of characters displayed in the row.
Select a chart color combination from the chart color scheme.
After selecting column data and row data, click Next step.
If necessary, you can arrange the data in ascending or descending order or set a threshold. Set the data to set the threshold and the threshold name, value, and color.
Preview the chart to be displayed in the upper right corner.
After checking the chart, enter a chart name and press SAVE to create chart data, and you can see that there is one more hexagon next to it.