2 posts tagged with "Data"

View All Tags

With the data you have… Anyone can visualize.

· 2 min read
Sangwon Jin
CEO of SCLAB and Founder

Data visualization is a very effective tool to help you understand and analyze your data more efficiently. But just because you have data doesn’t mean you can blindly visualize it.

laptop

The data must be refined to some extent for data visualization. The data must be free from errors such as missing values or outliers. Otherwise, visualization results may convey misleading information.

In addition, specific knowledge and skills were required depending on the type of data visualization produced. For example, drawing a bar graph is relatively simple, but map visualization requires geographic information (GIS) and cartography skills.

Visualization cannot be done with only data. To visualize data, it is necessary to understand and analyze the data well before selecting and using appropriate visualization methods and tools. Therefore, understanding and analysis of data, as well as knowledge and skills for visualization, are all required to visualize data.

SCLAB Studio makes it easy for anyone to create data visualizations with no code.
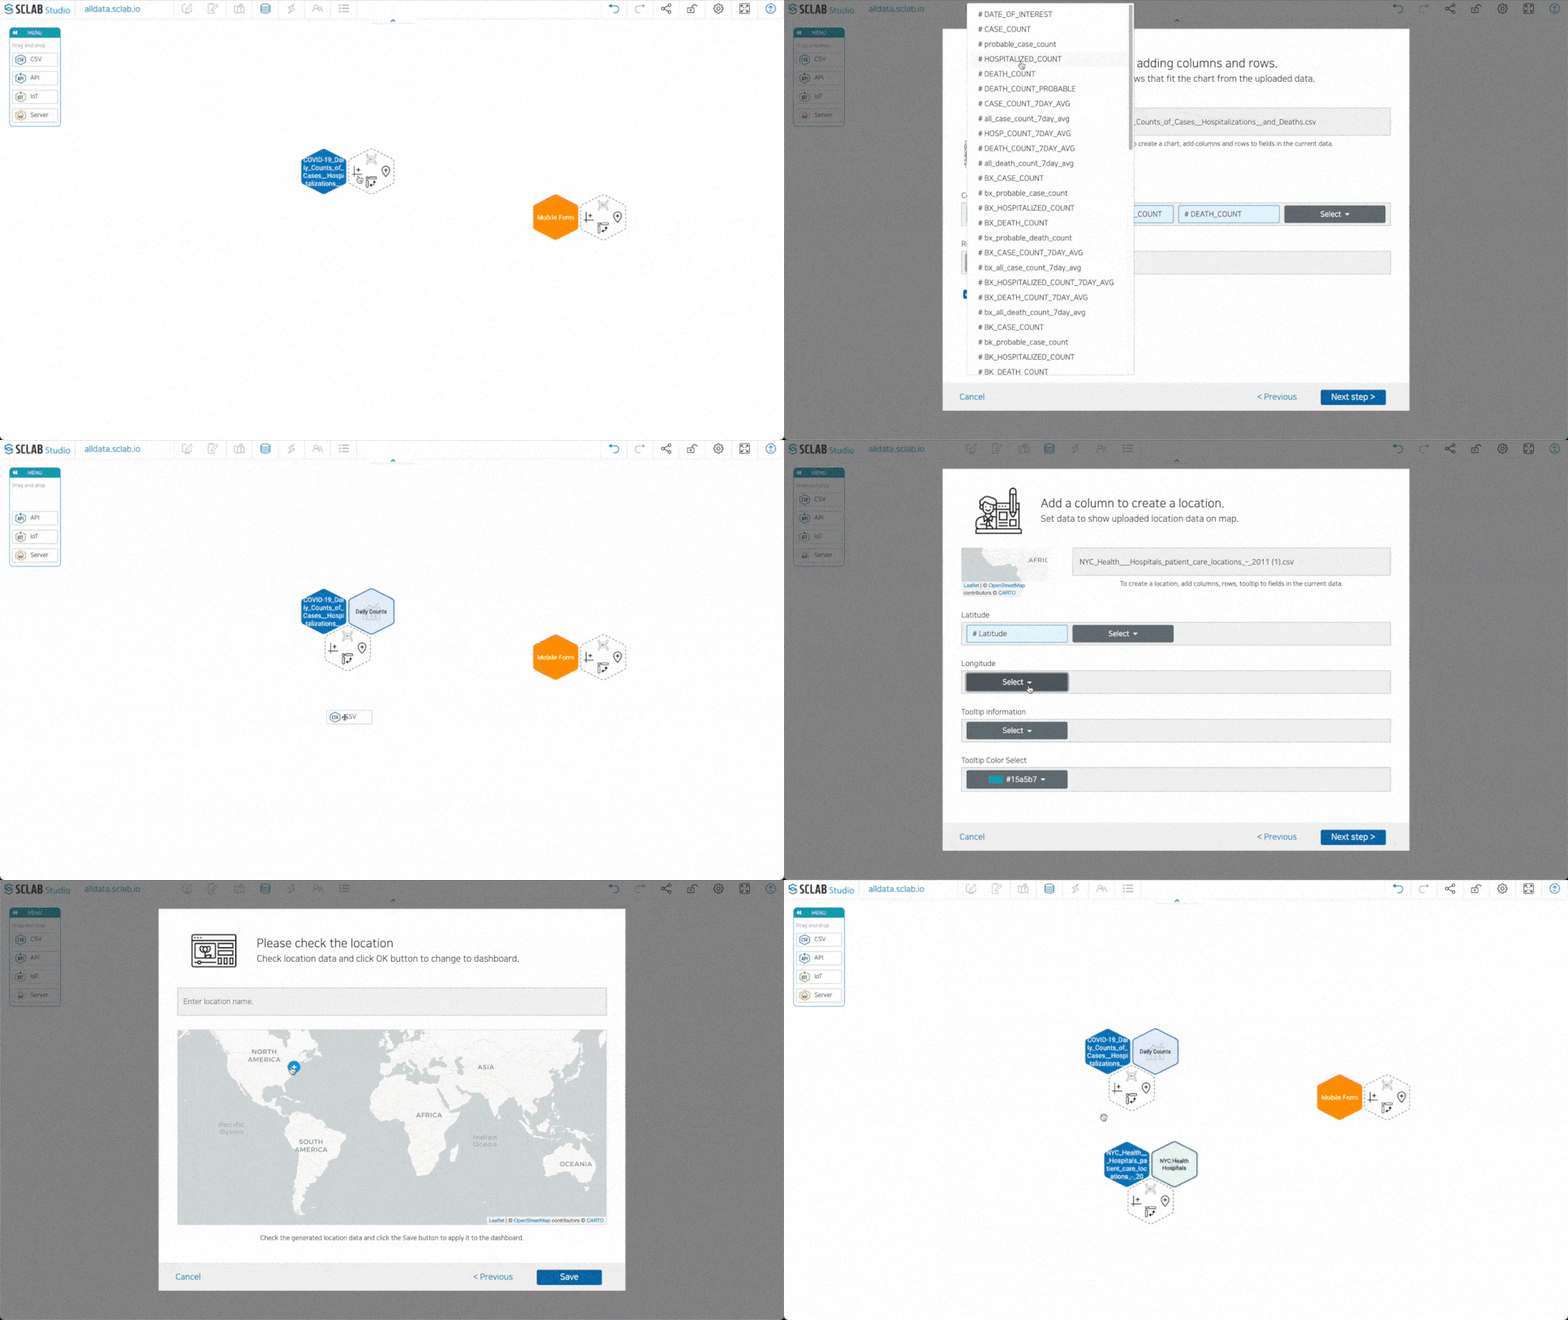
Data Editor

SCLAB Studio is a user-friendly data visualization authoring tool that allows users to create data visualizations using a simple drag-and-drop interface easily. This tool allows users to create maps from GIS and location data and display them on Internet maps. Just like making a presentation with PowerPoint, users can create various charts and graphs using their data without knowing the code.
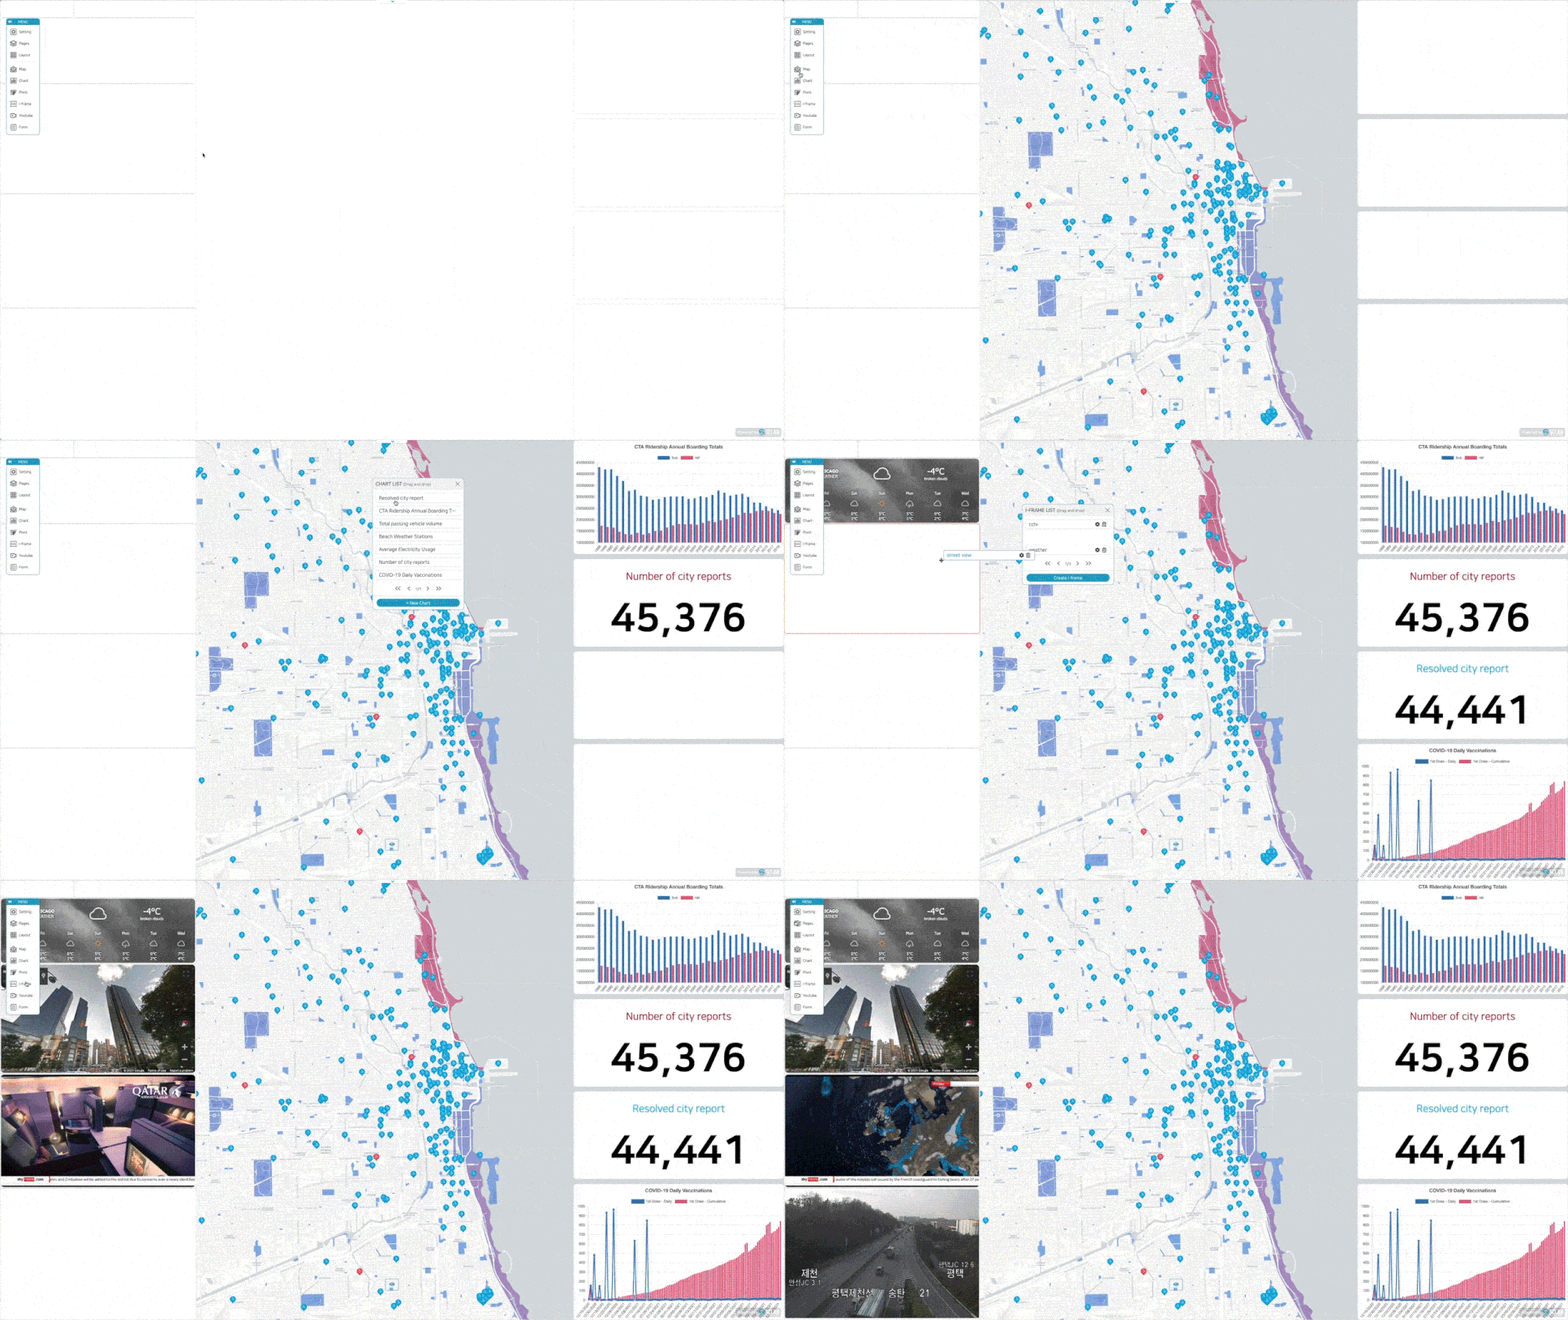
Page Editor

To use SCLAB Studio, users drag and drop various elements onto the layout to compose the screen. You can then apply charts and maps to your layout with a simple drag-and-drop. This makes the entire process of creating data visualizations quick and easy.

SCLAB Studio allows users to connect widgets and IP CCTVs using i-frames and insert YouTube videos. Users can easily add rich multimedia elements to data visualizations without knowing the code.
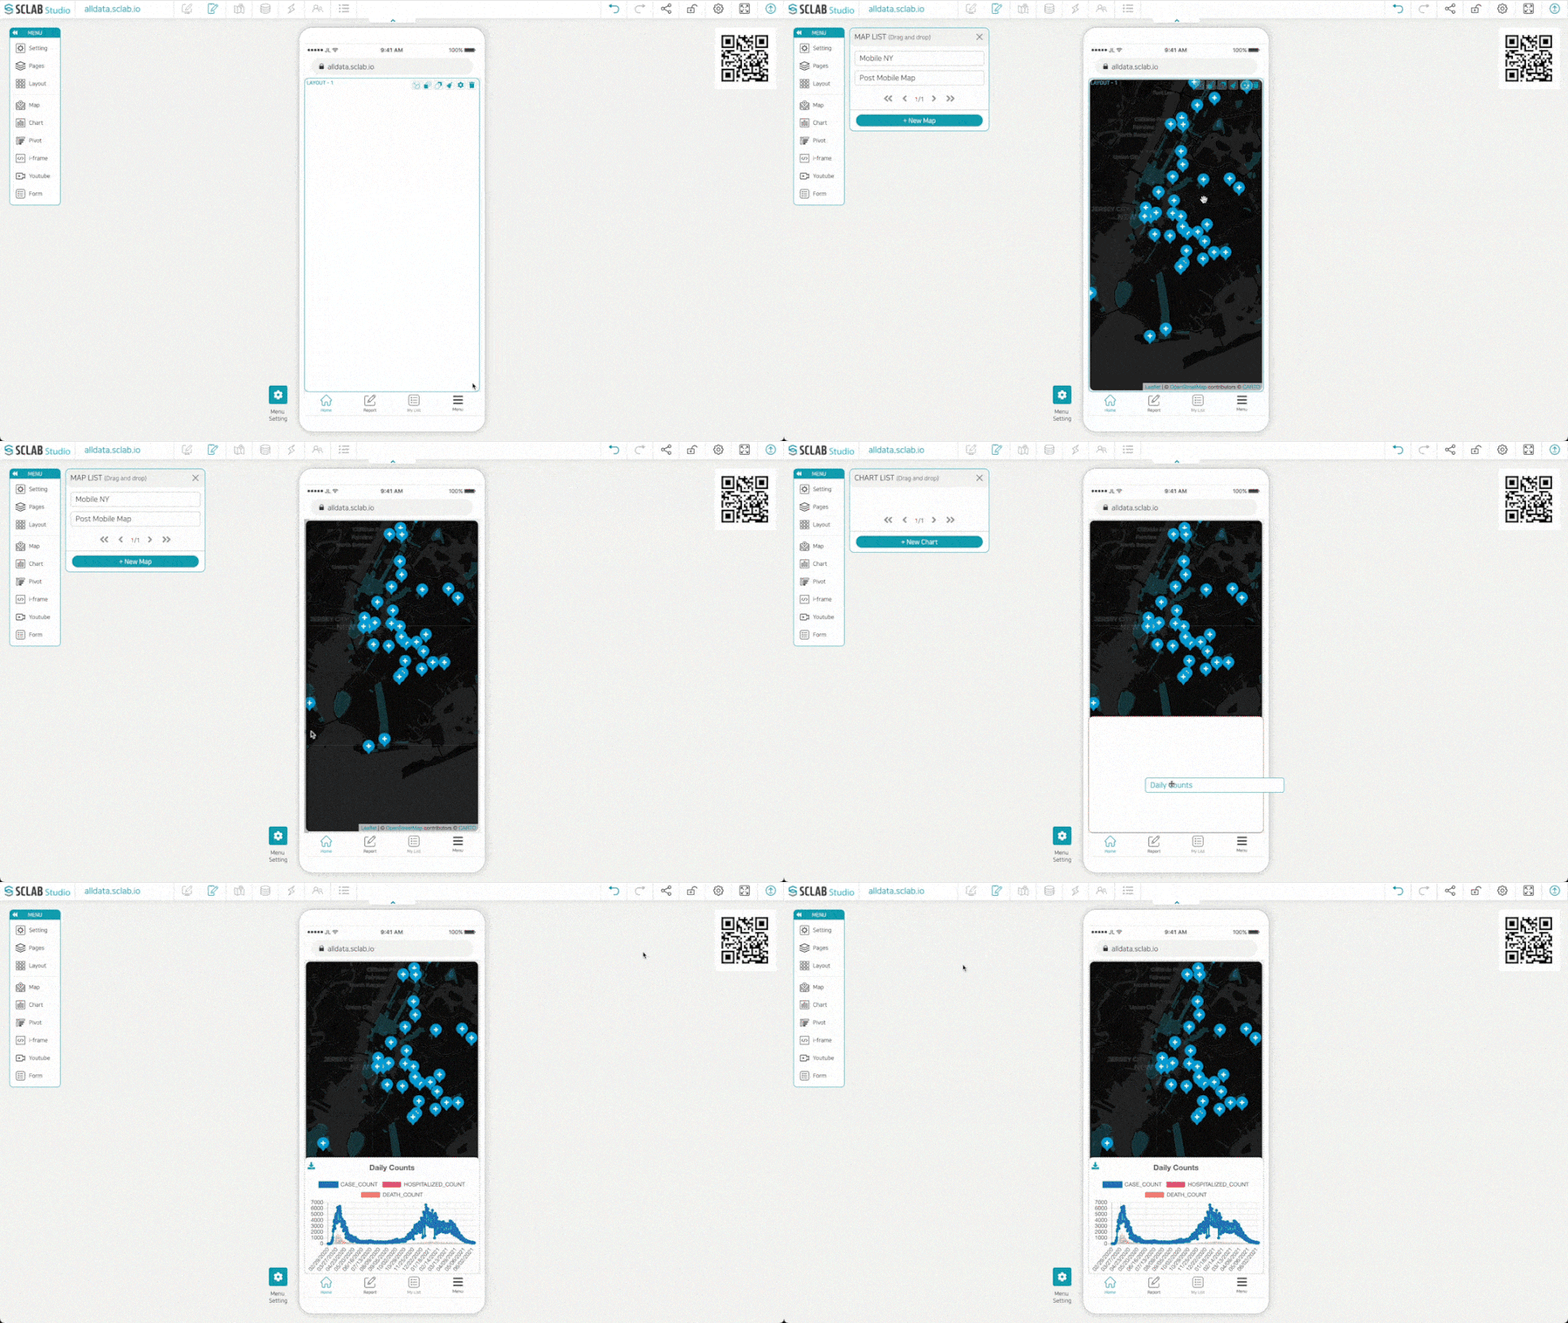
Mobile Editor

Finally, SCLAB Studio allows you to create data visualizations on mobile without any additional development. Users can easily create data visualizations through the mobile editor as simply as they create desktop visualizations. Overall, SCLAB Studio is a versatile and easy-to-use data visualization tool that helps businesses and individuals easily create visually appealing data displays.


7 reasons why data visualization is a must

· 2 min read
Sangwon Jin
CEO of SCLAB and Founder

Code

Data visualization has become an essential tool for decision-making in various industries. With the increasing volume of data available, it is more important than ever to understand and present data clearly and effectively. Here are seven reasons why data visualization is a must:

  1. Data is more accessible with visualization. One of the most significant benefits of data visualization is that it makes complex data more accessible to a broader audience. Charts, graphs, and other visual aids make it easier to understand data patterns and relationships, enabling people to quickly and easily identify trends and insights.

  2. Enhances data comprehension. Visualizing data helps people to comprehend better and interpret large volumes of data. People can more easily identify relationships, patterns, and trends by presenting data more engagingly and understandably. This can lead to faster and more effective decision-making.

  3. Helps to identify patterns and trends Data visualization tools enable users to identify patterns and trends in large data sets quickly. This can lead to better decision-making, allowing users to identify areas of opportunity or potential problems efficiently.

  4. Simplifies complex data. Data visualization tools make complex data more manageable and easier to understand. By presenting complex data in a simple and easy-to-understand format, users can more easily identify important insights and trends.

  5. Facilitates collaboration Visualization tools enable teams to collaborate more effectively by allowing them to view and analyze data together. This can help teams to identify and solve problems more quickly and to make better-informed decisions.

  6. Makes data more memorable. Visual aids are more memorable than text, making data more memorable when presented in a visual format. By presenting data in a way that is easy to understand and remember, people can more easily recall essential data points when needed.

  7. Provides a competitive advantage. Using data visualization tools, companies can gain a competitive advantage by identifying trends and patterns before their competitors. This can lead to more effective decision-making and better business outcomes.

In conclusion, data visualization is a must-have tool for decision-making in various industries. With the benefits of accessibility, comprehension, pattern identification, simplification, collaboration, memorability, and competitive advantage, data visualization is essential for anyone working with data. SCLAB Studio allows users to create data visualizations easily. SCLAB Studio is renowned for its user-friendly interface and intuitive design, allowing users to easily create custom visualizations and dashboards without coding skills.