How to create custom chart
You can make custom charts and visualizations using an iframe. You can assign one or more data to an iframe and use all of them inside the iframe. It works the same way in the editor and in the published site.
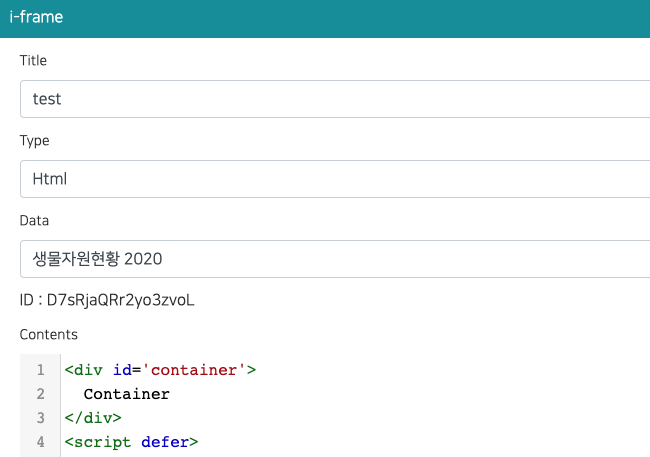
Assign data
In the iframe popup, choose one or more items in the Data field (multiple selection). If you do not select any data, the iframe receives no data.
GIS data (map boundaries)
You can also assign one or more GIS data (a GeoJSON / Shapefile you uploaded as GIS data) in the GIS Data field. Use it to draw regions on a map, for example a choropleth that colors provinces by a value from the assigned data.
Message protocol
-
The iframe asks the parent page for data with
postMessage.window.parent.postMessage("IFRAME_DATA_REQ,__IFRAME_ID_HERE__"); -
The parent page loads all assigned data, combines them and sends one message to the iframe. The same message is sent again whenever any of the assigned data is refreshed.
{
  type: "IFRAME_DATA_RES",

  // All assigned data (in the order of assignment)
  datasets: [
    { _dataId: "xxx", name: "Sales", success: true, columns: [...], rows: [...] },
    { _dataId: "yyy", name: "Users", success: false, error: "error message" }
  ],

  // Assigned GIS data (boundaries). Always present, possibly empty
  gis: [
    { _gisDataId: "zzz", name: "Provinces", success: true, featureCount: 17, bbox: [124.6, 33.1, 131.9, 38.6], simplified: false, geojson: { type: "FeatureCollection", features: [...] } }
  ],

  // Only the data that failed to load (empty array if everything succeeded)
  errors: [
    { _dataId: "yyy", name: "Users", error: "error message" }
  ],

  // For backward compatibility: columns/rows of the first successful dataset
  columns: [...],
  rows: [...]
}
Field Description datasets[].successtrueif the data was loaded,falseif it faileddatasets[].columns,datasets[].rowsThe data (only when successistrue)datasets[].errorThe failure reason (only when successisfalse)gis[].geojsonA GeoJSON FeatureCollectionof the GIS data. Coordinates are rounded to 5 decimals and simplified when the data is large (simplified: true)gis[].featureCount,gis[].bboxNumber of features and the extent [minLng, minLat, maxLng, maxLat]gis[].success,gis[].errorfalsewith the reason when the GIS data could not be loadederrorsThe list of failed datasets columns,rowsFirst successful dataset. Existing iframes that use a single data keep working without any change
Data that fails to load (for example, no permission or a connection error) does not block the other data.
Failed data is delivered together with its error in datasets / errors.
Example: show several data in one iframe
<div id='container'>
  Loading...
</div>
<script defer>
  function render(msg){
    const container = document.getElementById('container');
    let html = '';

    // Failed data
    (msg.errors || []).forEach((e) => {
      html += '<p style="color:red">' + e.name + ' : ' + e.error + '</p>';
    });

    // Draw every loaded dataset (replace this part with your own chart)
    (msg.datasets || []).filter((d) => d.success).forEach((d) => {
      html += '<h4>' + d.name + ' (' + d.rows.length + ' rows)</h4>';
      html += '<pre>' + JSON.stringify(d.columns) + '</pre>';
    });

    container.innerHTML = html;
  }

  (function(){
    window.addEventListener("message", (event)=>{
      if(event.data && event.data.type === "IFRAME_DATA_RES"){
        render(event.data);
      }
    });

    //window.parent.postMessage("IFRAME_DATA_REQ,D7sRjaQRr2yo3zvoL");
    window.parent.postMessage("IFRAME_DATA_REQ,__IFRAME_ID_HERE__");
  })();
</script>
change ID to your iframe id
Example: color regions with GIS boundaries
Join the data rows to the boundary features by a key (for example the region name), then draw them with Leaflet or ECharts.
Compare keys as strings: numeric-looking property values (such as 11) are stored as numbers when the GIS data is uploaded.
<link rel="stylesheet" href="/static/leaflet/leaflet.css">
<script src="/static/leaflet/leaflet.js"></script>
<div id="map" style="height:100vh"></div>
<script>
  var map = L.map('map');
  window.addEventListener('message', function (event) {
    var msg = event.data;
    if (!msg || msg.type !== 'IFRAME_DATA_RES') return;
    var rows = msg.datasets[0].rows;            // [[regionName, value], ...]
    var values = new Map(rows.map(function (r) { return [String(r[0]).trim(), r[1]]; }));
    var fc = msg.gis[0].geojson;
    var layer = L.geoJSON(fc, {
      style: function (f) {
        var v = values.get(String(f.properties.REGION_NAME).trim());
        return { fillColor: v > 1000 ? '#08519c' : '#9ecae1', fillOpacity: 0.8, weight: 1, color: '#fff' };
      }
    }).addTo(map);
    map.fitBounds(layer.getBounds());
  });
  window.parent.postMessage('IFRAME_DATA_REQ,__IFRAME_ID_HERE__');
</script>
Libraries hosted by the app can be loaded with absolute paths (they also work after publishing and on-premise):
/static/echarts/echarts.min.js (ECharts), /static/chartjs/chart.js (Chart.js), /static/threejs/sclab-three.min.js (three.js, global SCLAB_THREE), /static/leaflet/leaflet.js and /static/leaflet/leaflet.css (Leaflet).
Existing iframes (single data)
Iframes created with a single data keep working as before.
data.columns and data.rows are still delivered, so no code change is required.
To use the new feature, read data.datasets instead.
API
When you create or update an iframe with the REST API, use _dataIds (array of data ids).
The old _dataId (single id) is still accepted.